Obesity Prediction Web App using Machine Learning
A Streamlit-based interactive web application that predicts an individual's obesity level based on lifestyle and physical metrics using a machine learning model trained on an international dataset.
Role
Data Scientist, Machine Learning Engineer
Partner
Independent (Solo Project)
Platform
Web and Mobile Apps
Intro
Building an Accessible Obesity Prediction Tool
This project was initiated to create an accessible web-based tool that can estimate an individual's obesity level using machine learning. By leveraging survey data from Latin American countries, the model helps users understand their risk category based on inputs such as age, eating habits, physical activity, and water intake. The application is built for general users and health education purposes.
Dataset Explanations
The dataset contains 2,111 entries from Mexico, Peru, and Colombia, collected from online surveys and synthetic data via SMOTE. It includes 17 features such as demographic attributes, eating habits, and physical activity. The target variable, NObeyesdad, represents 7 obesity levels:
Insufficient Weight
Normal Weight
Overweight Level I & II
Obesity Type I, II, III
Features

Key Features
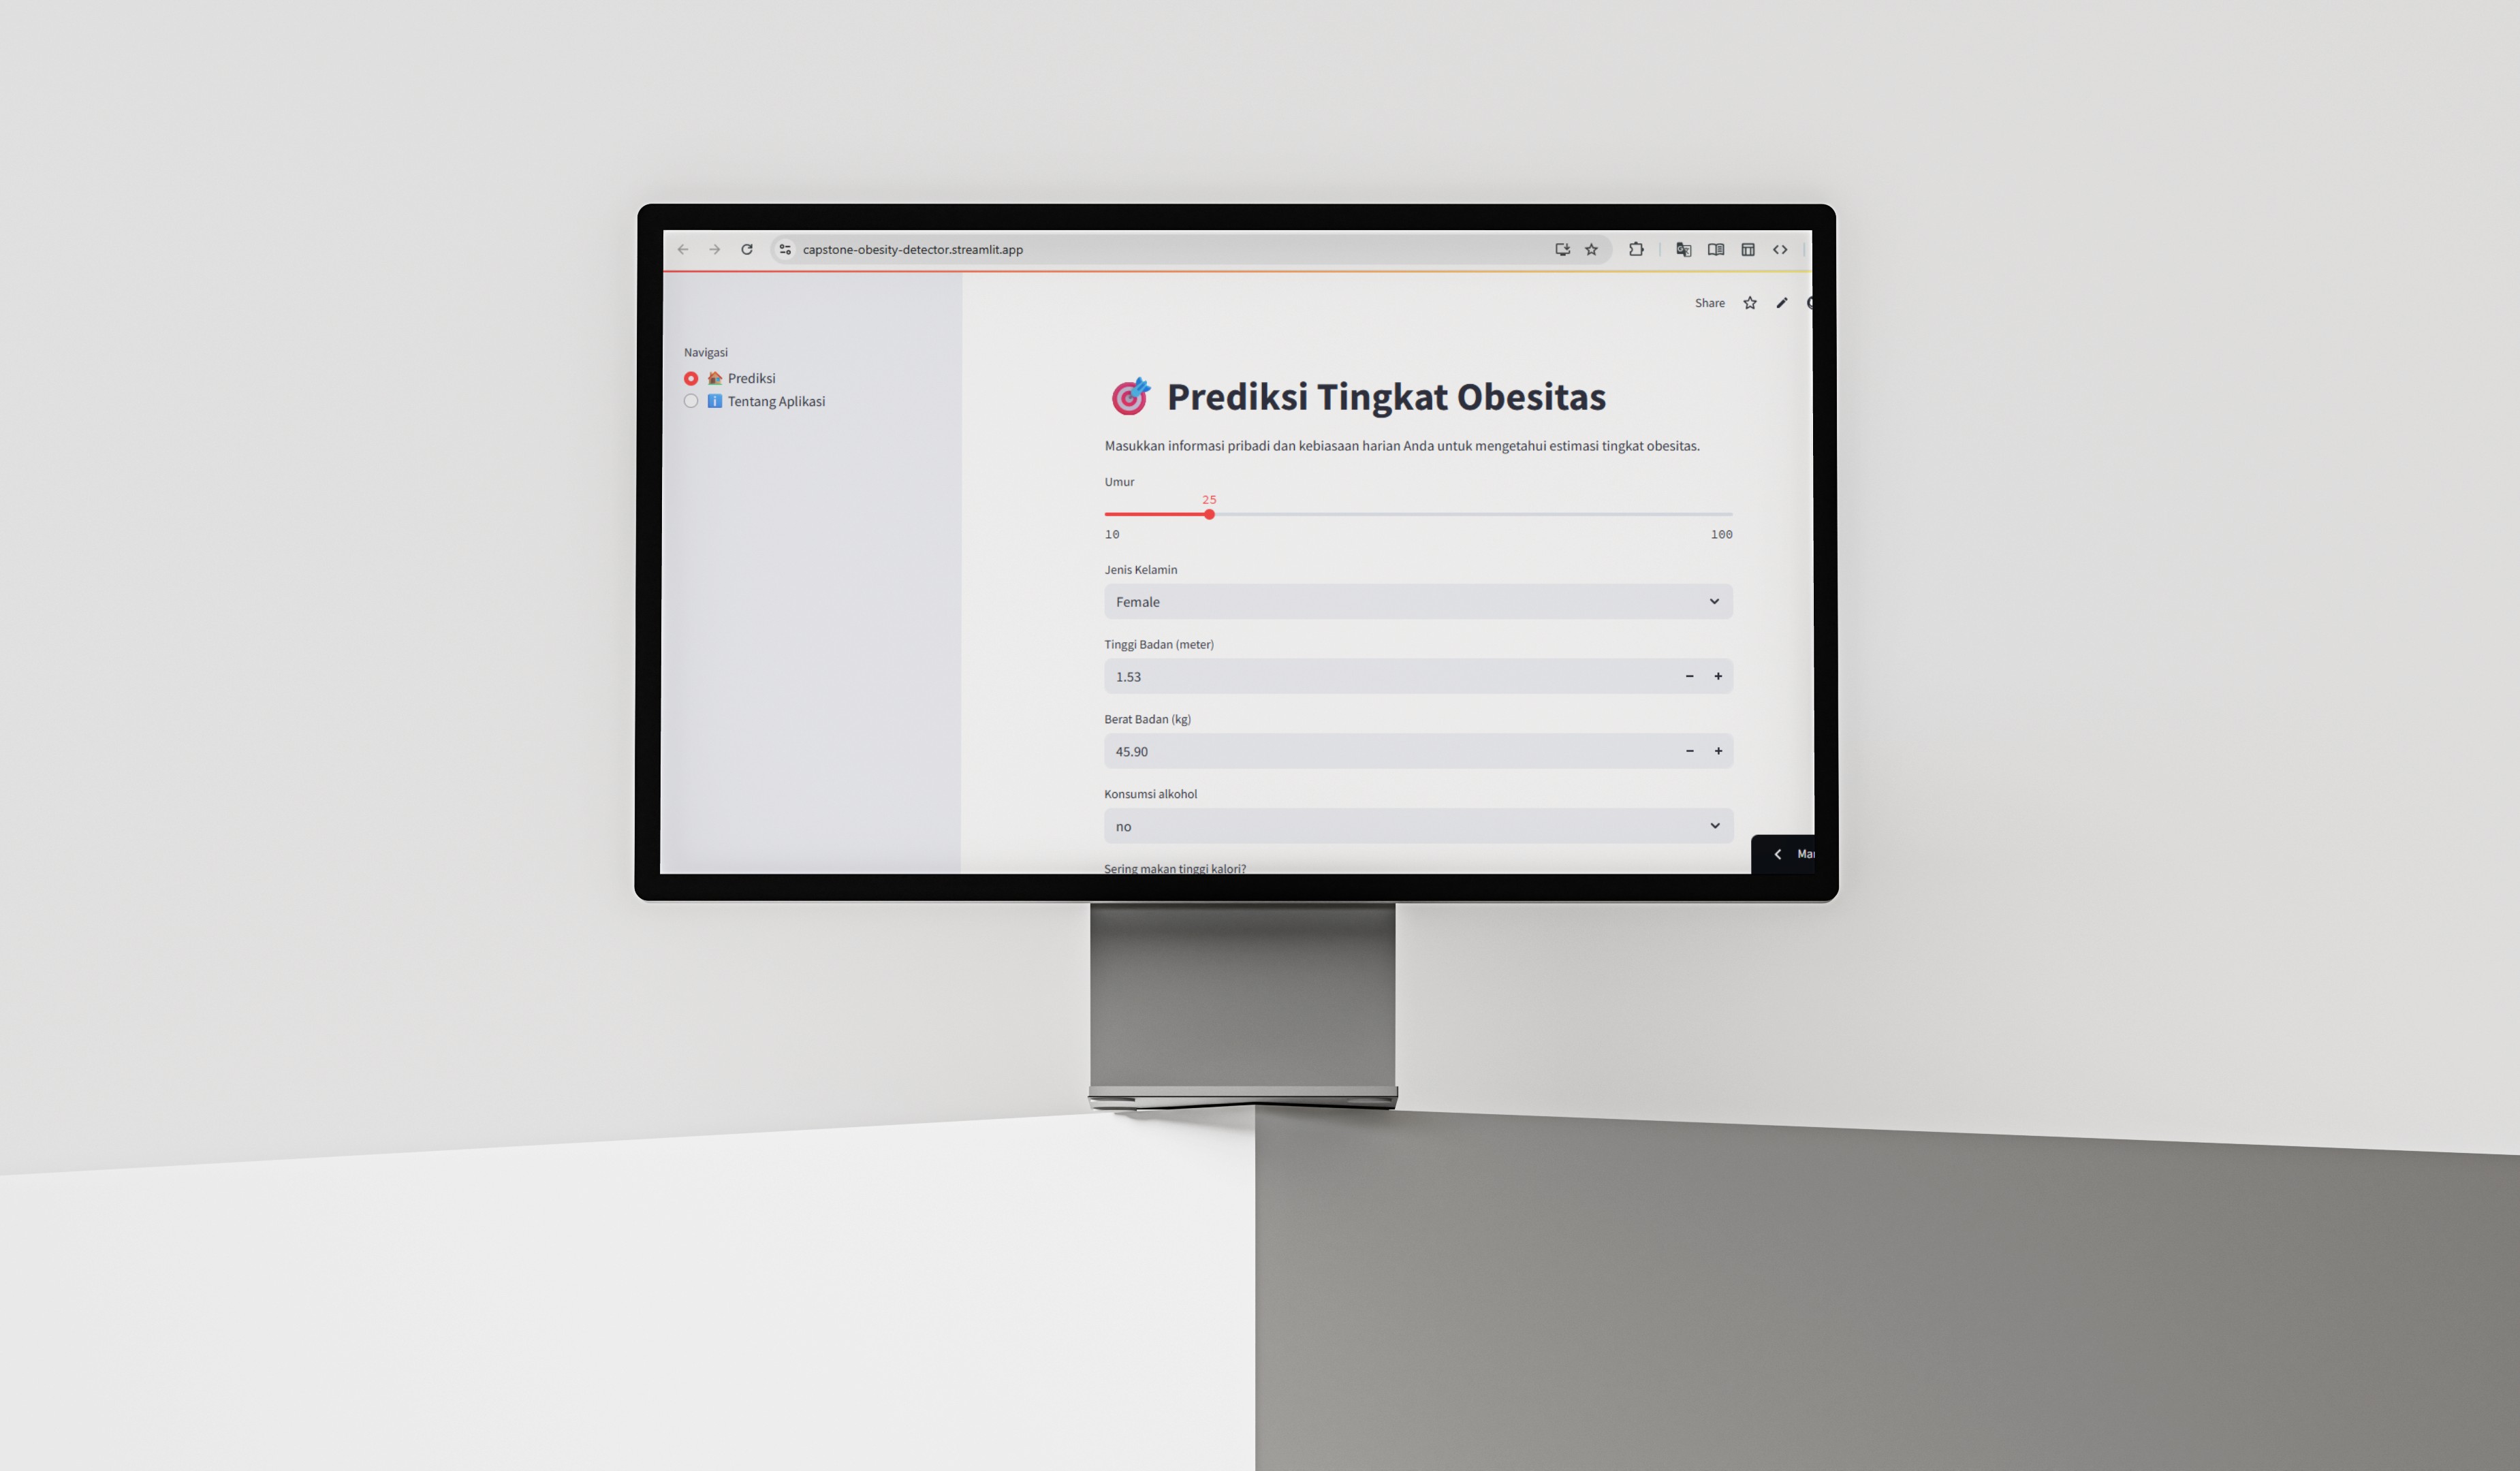
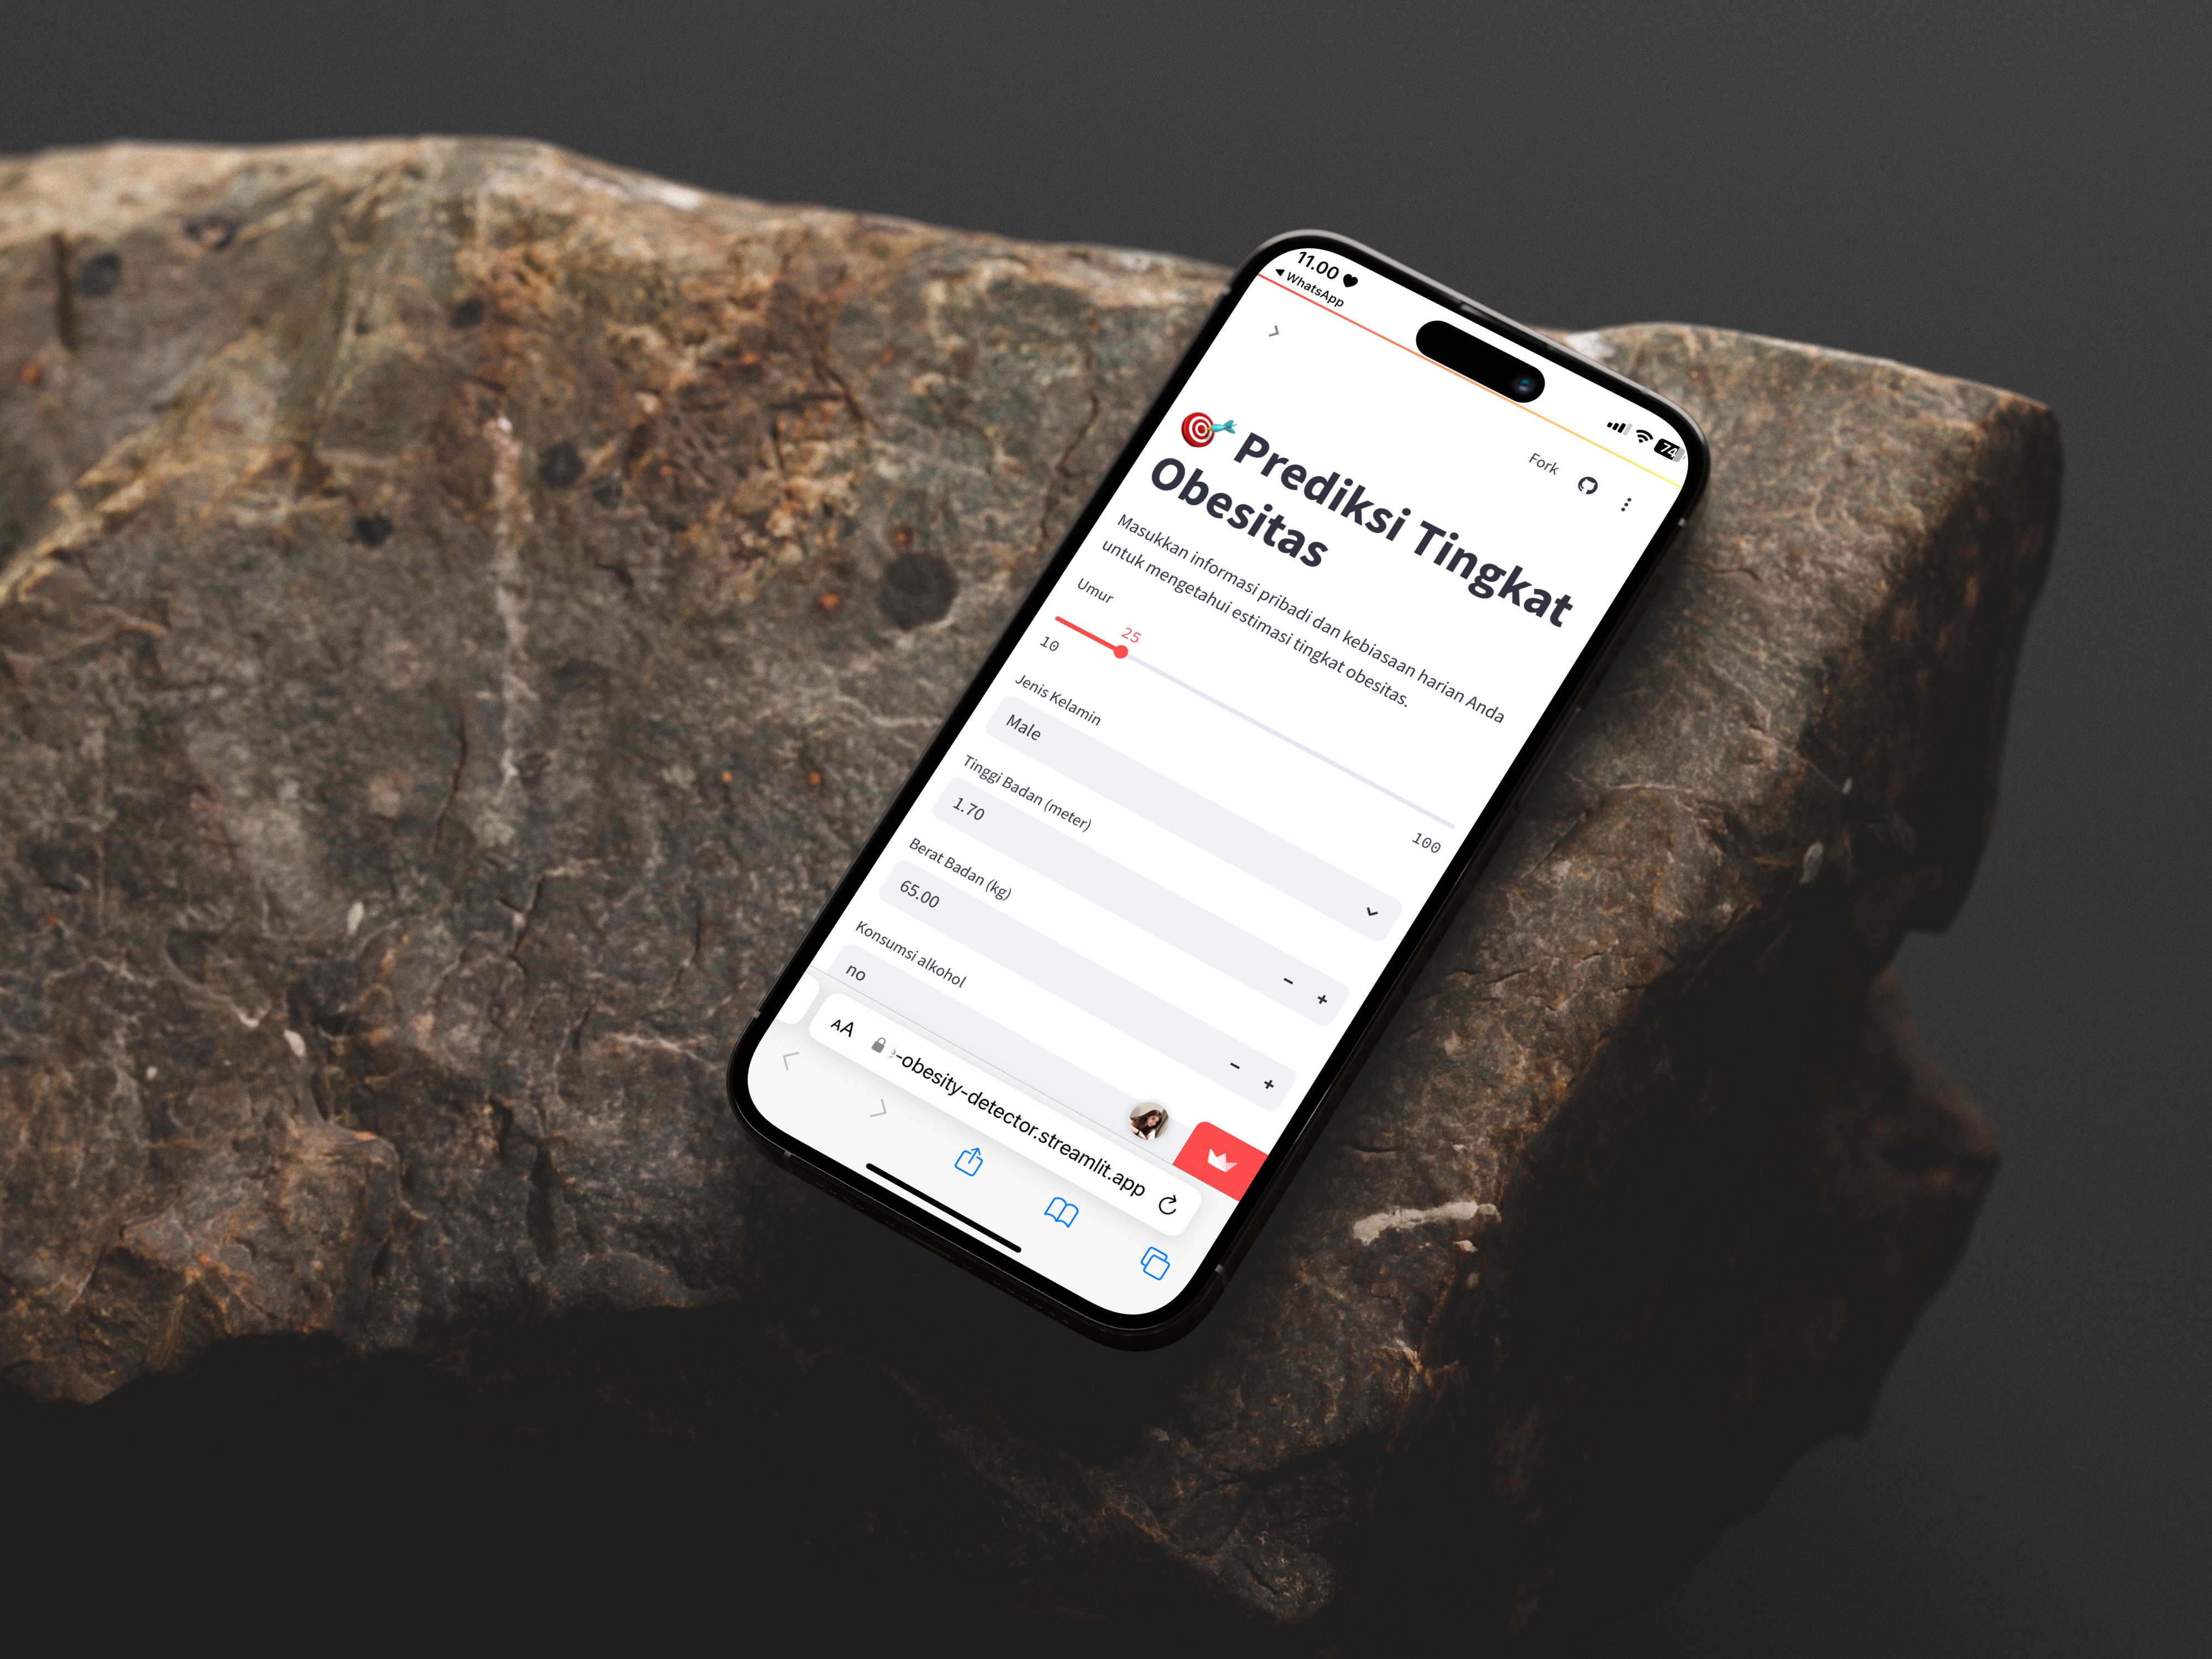
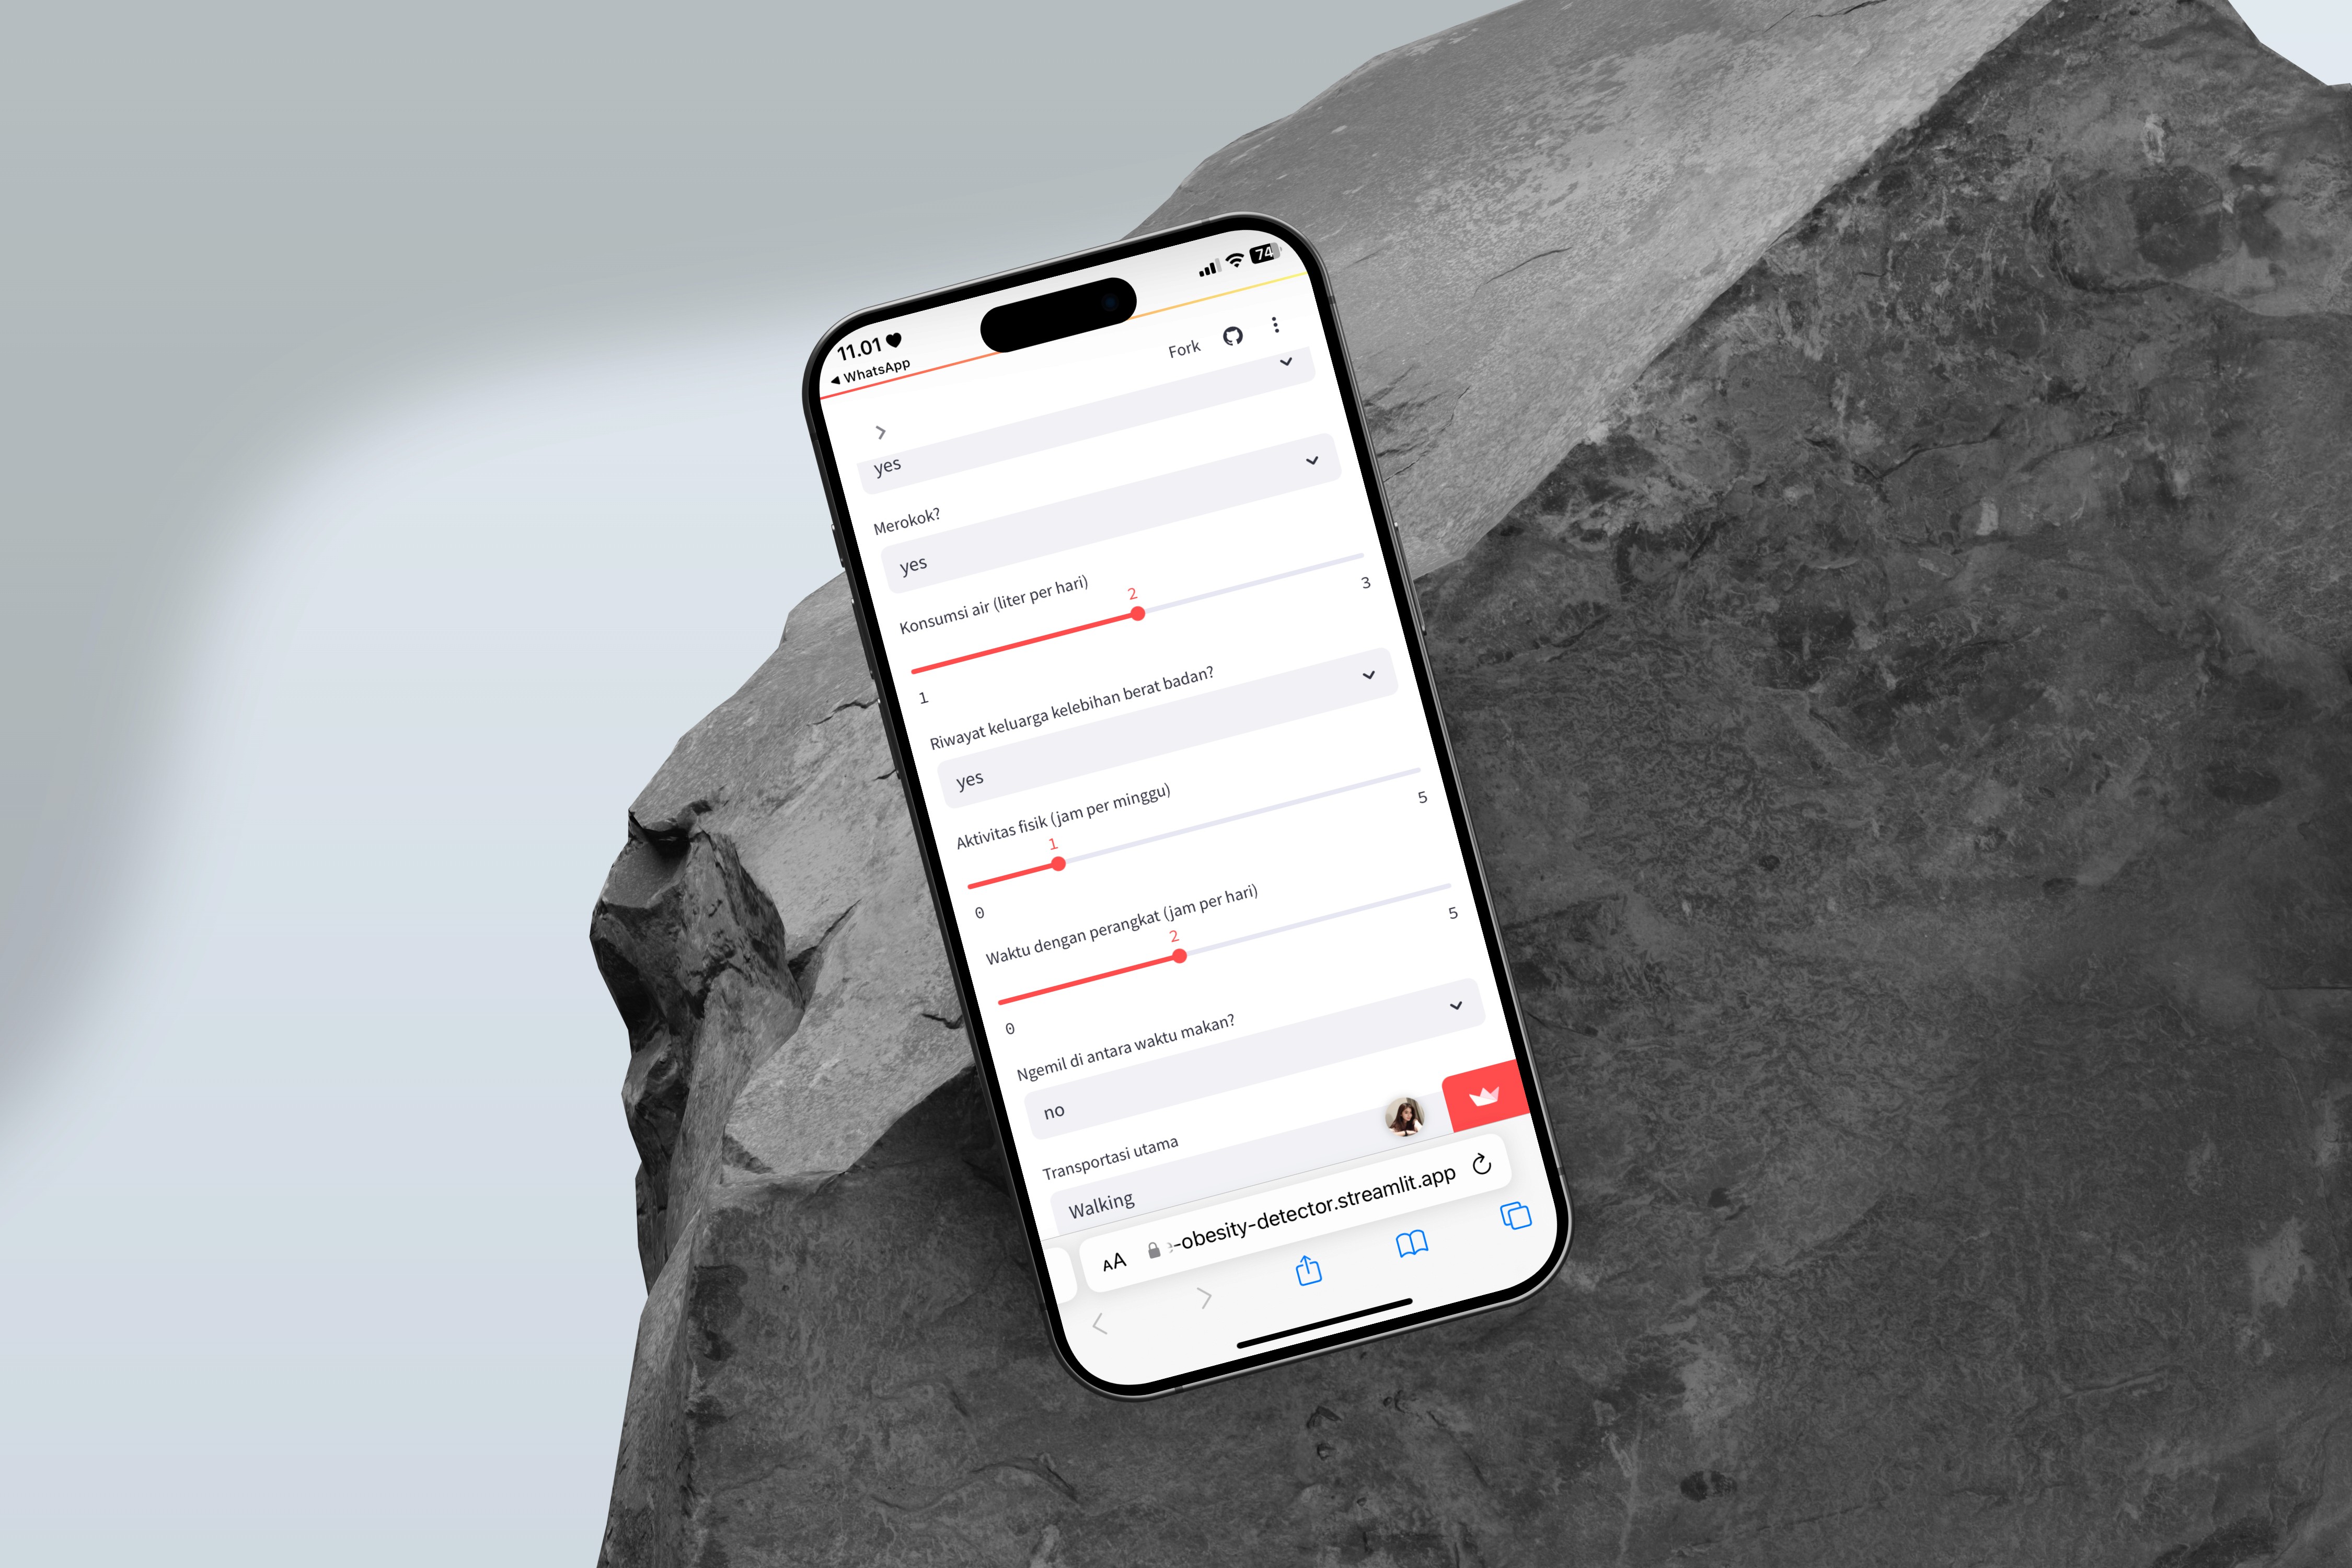
Real-time prediction of obesity level based on 16 lifestyle related inputs.
Responsive and userfriendly interface using Streamlit.
Includes categorical and numerical input fields such as:
Age, Gender, Height, Weight
Frequency of eating vegetables
Alcohol and fast food consumption
Physical activity level
Technology usage and transportation habits
Model performance was improved through preprocessing, balancing (SMOTE), and hyperparameter tuning.
Key Features
Real-time prediction of obesity level based on 16 lifestyle related inputs.
Responsive and userfriendly interface using Streamlit.
Includes categorical and numerical input fields such as:
Age, Gender, Height, Weight
Frequency of eating vegetables
Alcohol and fast food consumption
Physical activity level
Technology usage and transportation habits
Model performance was improved through preprocessing, balancing (SMOTE), and hyperparameter tuning.
Tools


Conclusion
Outcome & Deployment
The machine learning model (Random Forest) achieved reliable results and was deployed as a user-friendly web application. Users can receive personalized predictions in seconds. This project demonstrates end-to-end data science capability from data wrangling, modeling, and evaluation, to realtime deployment using Streamlit Cloud.
The tool can be extended for real-world health monitoring use cases or educational purposes.
CATEGORY
Obesity Prediction
Obesity Prediction
Obesity Prediction
Streamlit
Streamlit
Streamlit
Data Science
Data Science
Data Science
Machine Learning
Machine Learning
Machine Learning
DURATION
May 2025